Note
Click here to download the full example code
Graphs with string node labels
pymocd reads node ids as integers. Relabel a graph whose nodes are strings,
run pymocd.rimpso on it, and map the communities back to the
original names. The example uses the Les Misérables co-appearance network that
ships with NetworkX, whose nodes are character names.
String labels are rejected
Passing the graph as it is raises a RuntimeError, because every node id
must be an integer. The Input graphs page
lists the accepted inputs.
from collections import Counter

import matplotlib.pyplot as plt
import networkx as nx

import pymocd

L = nx.les_miserables_graph()
print(f"{L.number_of_nodes()} nodes, {L.number_of_edges()} edges, e.g. {list(L)[:3]}")

try:
    pymocd.rimpso(L)
except RuntimeError as err:
    print(f"RuntimeError: {err}")
Out:
77 nodes, 254 edges, e.g. ['Napoleon', 'Myriel', 'MlleBaptistine']
RuntimeError: Failed getting node id's. Verify if all Graph.nodes are positive integers; <str> as node_id isn't supported
Relabel, detect, map back
nx.convert_node_labels_to_integers numbers the nodes 0, 1, 2, ... and,
with label_attribute="name", keeps each original label as a node
attribute. The partition is keyed by the integer ids; the attribute turns it
back into names.
G = nx.convert_node_labels_to_integers(L, label_attribute="name")
partition = pymocd.rimpso(G)
names = nx.get_node_attributes(G, "name")

members = {}
for v, c in partition.items():
    members.setdefault(c, []).append(names[v])

print(f"{len(members)} communities")
for c, group in sorted(members.items(), key=lambda item: -len(item[1])):
    shown = ", ".join(sorted(group)[:6]) + (", ..." if len(group) > 6 else "")
    print(f"community {c:>2} ({len(group):>2}): {shown}")
Out:
13 communities
community  1 (19): Anzelma, Babet, Brujon, Claquesous, Cosette, Eponine, ...
community  9 (13): Bahorel, Bossuet, Combeferre, Courfeyrac, Enjolras, Feuilly, ...
community  2 (11): Blacheville, Dahlia, Fameuil, Fantine, Favourite, Listolier, ...
community  0 (10): Champtercier, Count, CountessDeLo, Cravatte, Geborand, MlleBaptistine, ...
community  5 ( 6): Bamatabois, Brevet, Champmathieu, Chenildieu, Cochepaille, Judge
community 10 ( 6): BaronessT, Gillenormand, LtGillenormand, Magnon, MlleGillenormand, MlleVaubois
community  4 ( 3): Fauchelevent, Gribier, MotherInnocent
community  6 ( 2): MmePontmercy, Pontmercy
community  8 ( 2): Jondrette, MmeBurgon
community 12 ( 2): Child1, Child2
community  3 ( 1): MmeDeR
community  7 ( 1): Boulatruelle
community 11 ( 1): MotherPlutarch
Draw it with names
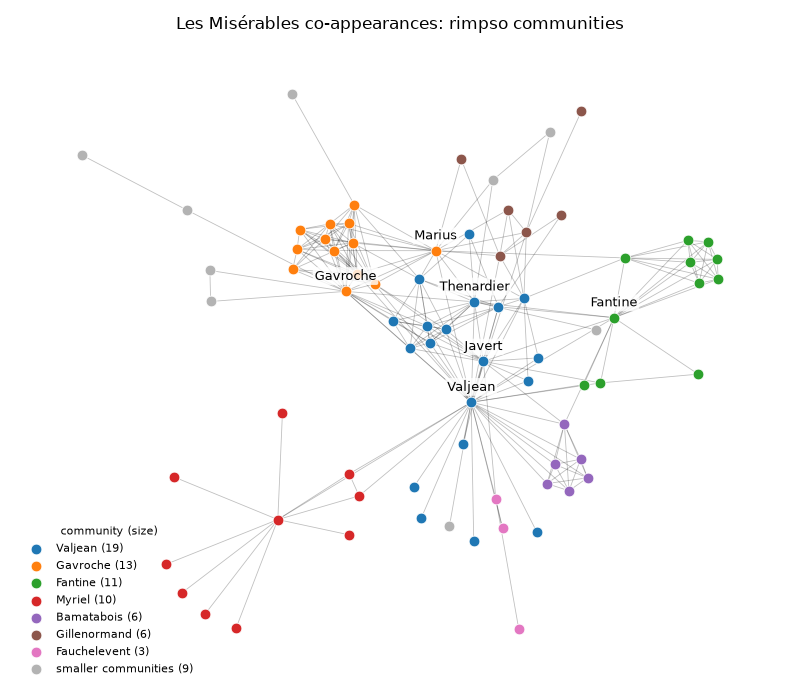
The communities with at least three characters are colored, up to nine of
them (the tab10 palette without its gray); the rest are gray. Each colored
community is named in the legend after its highest-degree character, and the
six highest-degree characters are labeled on the graph.
sizes = Counter(partition.values())
colored = [c for c, size in sizes.most_common() if size >= 3][:9]
palette = [color for i, color in enumerate(plt.colormaps["tab10"].colors) if i != 7]
color_of = {c: palette[i] for i, c in enumerate(colored)}

degree = dict(G.degree())
hubs = sorted(G, key=degree.get, reverse=True)[:6]

pos = nx.spring_layout(G, k=0.25, seed=2, weight=None)

fig, ax = plt.subplots(figsize=(8, 7))
nx.draw_networkx_edges(G, pos, ax=ax, width=0.6, alpha=0.25)
for c in colored:
    nodes = [v for v in G if partition[v] == c]
    leader = max(nodes, key=degree.get)
    nx.draw_networkx_nodes(
        G,
        pos,
        nodelist=nodes,
        node_color=[color_of[c]],
        node_size=60,
        edgecolors="white",
        linewidths=0.6,
        ax=ax,
        label=f"{names[leader]} ({len(nodes)})",
    )
rest = [v for v in G if partition[v] not in color_of]
if rest:
    nx.draw_networkx_nodes(
        G,
        pos,
        nodelist=rest,
        node_color="0.7",
        node_size=60,
        edgecolors="white",
        linewidths=0.6,
        ax=ax,
        label=f"smaller communities ({len(rest)})",
    )
for v in hubs:
    ax.annotate(
        names[v],
        pos[v],
        xytext=(0, 6),
        textcoords="offset points",
        ha="center",
        va="bottom",
        fontsize=9,
        bbox={"boxstyle": "round,pad=0.15", "facecolor": "white", "edgecolor": "none", "alpha": 0.8},
    )
ax.set_title("Les Misérables co-appearances: rimpso communities", fontsize=12)
ax.legend(loc="lower left", fontsize=8, frameon=False, title="community (size)", title_fontsize=8)
ax.set_axis_off()
fig.tight_layout()
plt.show()
Edge weights are ignored
Every edge of this graph carries a weight attribute, but pymocd reads only
the two endpoints of each edge (get_edges in src/core/graph/adj.rs), so
every detector sees the unweighted graph. Because rimpso is deterministic,
this is easy to confirm: dropping the weights gives the same partition. The
only place weights can enter is a custom objective passed to
pymocd.HpMocd, which receives the original NetworkX graph
(see Custom objectives with HpMocd).
unweighted = nx.Graph()
unweighted.add_nodes_from(G)
unweighted.add_edges_from(G.edges())

print(f"weighted input: {nx.is_weighted(G)}, unweighted copy: {nx.is_weighted(unweighted)}")
print(f"same partition: {pymocd.rimpso(unweighted) == partition}")
Out:
Total running time of the script: ( 0 minutes 0.176 seconds)
Download Python source code: plot_les_miserables.py