Note
Click here to download the full example code
Custom objectives with HpMocd
Replace HP-MOCD's built-in objectives with two Python functions, record the size of the first front at every generation, and plot the Pareto front the search returns.
Define the objectives
pymocd.HpMocd accepts objectives, a list of callables
(graph, partition) -> float. Every objective is minimized, and a
non-empty list replaces the built-in intra/inter pair. graph is the object
passed to the constructor, here the NetworkX graph itself, and partition is
a dict mapping each node to a community id. One dict serves a whole batch
of evaluations (the initial population, or one generation's offspring) and is
cleared and refilled for each individual, so an objective must not keep a
reference to it; copy it if you need it later.
The two objectives below pull in opposite directions:
- \(-Q\), Newman modularity negated so that minimizing it maximizes \(Q\).
weight=Nonemakes NetworkX ignore theweightattribute of the karate club edges, so \(Q\) is computed on the same unweighted graph the search itself works on. - \(s_{\max}/n\), the size of the largest community divided by the number of nodes \(n\). Minimizing it favors partitions without a dominant community.
from collections import Counter

import matplotlib.pyplot as plt
import networkx as nx

import pymocd


calls = 0


def negative_modularity(graph, partition):
    """-Q of the partition; lower is better."""
    global calls
    calls += 1
    communities = {}
    for v, c in partition.items():
        communities.setdefault(c, set()).add(v)
    return -nx.community.modularity(graph, communities.values(), weight=None)


def largest_community_fraction(graph, partition):
    """Size of the largest community over the number of nodes; lower is better."""
    return max(Counter(partition.values()).values()) / graph.number_of_nodes()
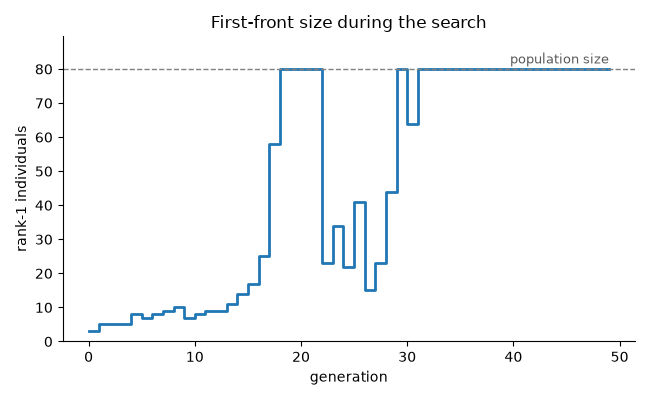
Run the search and record every generation
HpMocd.set_on_generation registers a
callback that receives (gen, num_gens, front_size) once per generation,
after the offspring are merged into the population; gen runs from 0 to
num_gens - 1. front_size counts the rank-1 individuals among the
pop_size parents that survived selection in that generation, rank 1 meaning
non-dominated in the pool that selection sorted. The offspring just bred are
not ranked yet, so front_size never exceeds pop_size.
HpMocd.generate_pareto_front runs
the search and returns [(partition, objectives), ...], with the objective
values in the order of the objectives list. Its members are the rank-1
survivors of the last generation, so their number equals the last
front_size. Every call to it, or to HpMocd.run,
starts a new search, and HP-MOCD is not deterministic, so call one of them
once and keep the result.
Python objectives are called once per individual: for the initial population and for the offspring of every generation.
G = nx.karate_club_graph()
pop_size, num_gens = 80, 50
model = pymocd.HpMocd(
    G,
    pop_size=pop_size,
    num_gens=num_gens,
    objectives=[negative_modularity, largest_community_fraction],
)

history = []
model.set_on_generation(lambda gen, num_gens, front_size: history.append((gen, front_size)))
front = model.generate_pareto_front()

print(f"{len(history)} generations recorded, last front size {history[-1][1]}")
print(f"{len(front)} members returned by generate_pareto_front")
expected = pop_size * (num_gens + 1)
print(f"negative_modularity was called {calls} times; pop_size * (num_gens + 1) = {expected}")
Out:
50 generations recorded, last front size 80
80 members returned by generate_pareto_front
negative_modularity was called 4080 times; pop_size * (num_gens + 1) = 4080
Front size per generation
gens = [gen for gen, _ in history]
sizes = [size for _, size in history]

fig, ax = plt.subplots(figsize=(6.5, 4))
ax.step(gens, sizes, where="post", color=plt.colormaps["tab10"](0), linewidth=2)
ax.axhline(pop_size, color="0.5", linestyle="--", linewidth=1)
ax.annotate(
    "population size",
    (gens[-1], pop_size),
    xytext=(0, 4),
    textcoords="offset points",
    ha="right",
    fontsize=9,
    color="0.35",
)
ax.set_xlabel("generation")
ax.set_ylabel("rank-1 individuals")
ax.set_title("First-front size during the search")
ax.set_ylim(0, pop_size * 1.12)
ax.spines[["top", "right"]].set_visible(False)
fig.tight_layout()
plt.show()
The final front
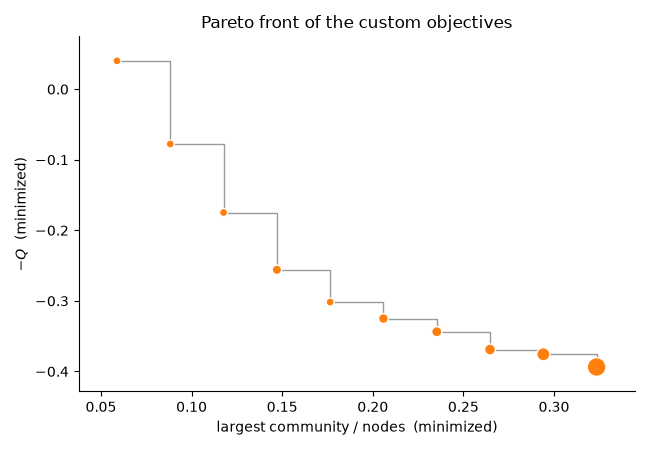
Several members of the front can share the same objective values, for example copies of one partition, so the plot draws each distinct point once and sizes it by how many members it stands for. Both axes are minimized, so the front bounds the lower left of the objective space: moving along it, a smaller largest community costs modularity.
n = G.number_of_nodes()
points = Counter((round(q, 9), round(s, 9)) for _, (q, s) in front)
order = sorted(points, key=lambda point: point[1])
xs = [s for _, s in order]
ys = [q for q, _ in order]

fig, ax = plt.subplots(figsize=(6.5, 4.5))
ax.step(xs, ys, where="post", color="0.6", linewidth=1, zorder=1)
ax.scatter(
    xs,
    ys,
    s=[30 + 4 * points[point] for point in order],
    color=plt.colormaps["tab10"](1),
    edgecolors="white",
    linewidths=1,
    zorder=2,
)
ax.set_xlabel("largest community / nodes  (minimized)")
ax.set_ylabel("$-Q$  (minimized)")
ax.set_title("Pareto front of the custom objectives")
ax.margins(0.08)
ax.spines[["top", "right"]].set_visible(False)
fig.tight_layout()
plt.show()

print(f"{'s_max':>5} {'Q':>7} {'members':>8}")
for q, s in order:
    print(f"{round(s * n):>5} {-q:>7.3f} {points[(q, s)]:>8}")
Out:
s_max       Q  members
    2  -0.040        1
    3   0.078        1
    4   0.175        1
    5   0.256        4
    6   0.302        1
    7   0.325        5
    8   0.344        6
    9   0.369        8
   10   0.376       15
   11   0.394       38
Pick a partition from the front
run() returns the member with the smallest sum of objective values. Under
the built-in objectives that is the highest-modularity member; with custom
objectives the sum is no longer modularity, so select from the front
yourself. Here the choice is the member with the highest \(Q\), scored against
the club's recorded split. See Working with Pareto fronts
for other ways to choose.
truth = {v: int(G.nodes[v]["club"] != "Mr. Hi") for v in G}
best, (neg_q, _) = min(front, key=lambda member: member[1][0])
k = len(set(best.values()))
print(f"{k} communities, Q = {-neg_q:.3f}, AMI = {pymocd.ami(best, truth):.3f}")
Out:
Total running time of the script: ( 0 minutes 0.513 seconds)
Download Python source code: plot_custom_objectives.py